Tropical Cyclone Marcus
Tropical Cyclone Marcus formed north of Croker Island Northern Territory around 10am (ACST) 16 March 2018. Tropical Cyclone Marcus intensified over the Van Diemen Gulf during 17 March into a Category 2 strength tropical cyclone on the coast of Darwin. The cyclone passed close to Darwin before moving into the Timor Sea late on the 17th. On 18 March Tropical Cyclone Marcus has approached the north Kimberley as a Category 2 strength cyclone.
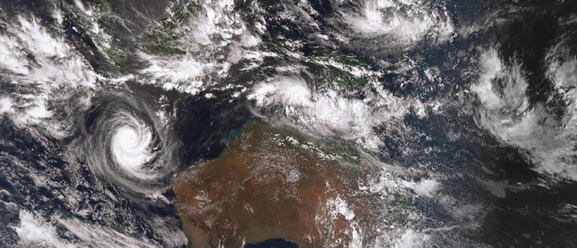
Tropical Cyclone Marcus continued across the Kimberley coast and into the Indian Ocean where the cyclone developed further into a category 5 Severe Tropical Cyclone while travelling south west. Marcus started to lose intensity while travelling south west towards the southern Western Australian coast and weaken to a low pressure system not affecting the coastal regions.
Intensity: category 3, sustained winds near the centre of 140 kilometres per hour with wind gusts to 195 kilometres per hour.
Location: within 35 kilometres of 22.7 degrees South, 106.1 degrees East , 830 kilometres west of Exmouth and 810 kilometres west northwest of Carnarvon .
Movement: south at 26 kilometres per hour .
From www.bom.gov.au.

Tropical Cyclone Marcus Technical detail

23/03/2018
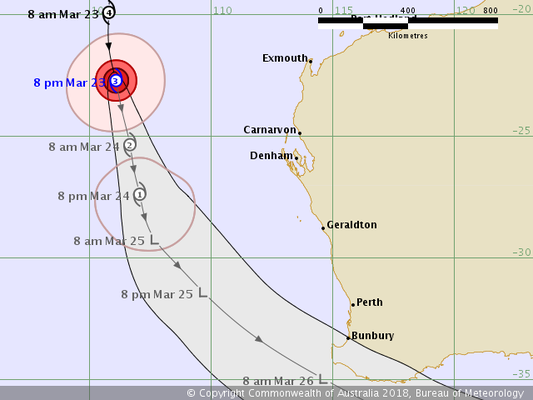
Marcus was located using animated VIS imagery and several microwave passes through the afternoon. Marcus has continued weakening with an eye no longer identifiable in EIR, microwave imagery shows deep convection is now confined to the southern quadrants.Dvorak: Embedded centre pattern: Surrounding grey shade is B which gives a CF of
5.0. The cold convection in EIR is fluctuating with the CF number between 4.5 and 5.0 over the last 6 hours. MET is 5.0 based on W- 24hr trend, adj MET and FT
are 5.0. CI is held at 5.0. CIMMS and NESDIS ADT are decreasing rapidly with 1 minute wind at around 60 knots. Recent microwave imagery produced a SATCON estimate at 0700 UTC which was at 83 knots 1-minute wind. Intensity is set at 75 knots. The mid-level trough to the west of Marcus is now the dominant steering mechanism. Recent movement hsa been showing signs of a south southeast trend developing. This is likely to continue as the system moves further south.
The 0600 UTC vertical wind shear from CIMSS is still low at 6 knots from the West. The shear will start to increase steadily as the system continues to track in a southward direction. The equatorward outflow channel has weakened substantially, though poleward outflow is still evident on sat imagery. As the system moves further south overnight Friday, closer to the mid-level trough, these conditions will become less favourable. CIMSS TPW shows drier air wrapping around the northern side of the system and is cutting the system off from the moist tropical environment.
Marcus is now moving over cooler water, SSTs will decrease below 26C and Ocean Heat Content becoming unfavourable.
Marcus is expected to weaken below tropical cyclone intensity late Saturday or
early Sunday.
22/03/2018:
Marcus was located using EIR and microwave imagery. Since about 0500 UTC, Marcus
has showed signs of intensification.
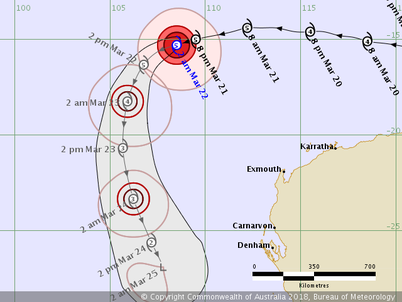
Dvorak: Eye pattern: Surrounding grey shade is W [ CMG near 20nm at min width], which gives an E no. of 6.0. E adj is +1.0 based on an WMG eye surrounded by CMG. Time averaged DT is 7.0. MET/PAT is 7.0 based on D trend and CI is 7.0.
Marcus has moved towards the west southwest over the last few hours as the influence of the mid-level ridge to the south starts to weaken. NWP is in strong
agreement that Marcus will continue to turn towards the southwest during Thursday and towards the south during Friday. Vertical wind shear is around 15 knots from the E. There is good upper divergence, particularly south of the system with dual outflow channels [poleward and equatorward]. Ocean Heat Content [OHC] is favourable and SSTs are around 28-30C along the forecast track for the next day or so. Shear should remain low over the next few days. Once Marcus tracks south of 20S, OHC is less favourable and SSTs decrease below 26/27C. Marcus is likely to peak in intensity this morning [Thursday], then start weakening later on Thursday as an approaching upper level trough helps steer the system towards the southwest and then towards the south on Friday with increasing shear. Decreasing SSTs and further increasing wind shear are expected to cause Marcus to weaken below tropical cyclone intensity late Saturday. From BOM technical bulletin 21/03/2018 1818 AEST.
17/03/2018: 0430 220900Z POSITION NEAR 17.1S 106.4E. TROPICAL CYCLONE (TC) 15S (MARCUS), LOCATED APPROXIMATELY 541 NM NORTHWEST OF LEARMONTH, AUSTRALIA, HAS TRACKED SOUTHWESTWARD AT 11 KNOTS OVER THE PAST SIX HOURS. ANIMATED ENHANCED INFRARED
SATELLITE IMAGERY DEPICTS A 12 NM EYE SURROUNDED BY DEEP CONVECTION THAT APPEARS TO BE WARMING SLIGHTLY OVER THE LAST SEVERAL HOURS. THE INITIAL INTENSITY IS ASSESSED AT 140 KNOTS WHICH IS BASED ON PGTW AND KNES CURRENT INTENSITY DVORAK ESTIMATES OF T7.0 (140 KNOTS). RECENT DVORAK DATA-T ANALYSES OF T6.5 SUGGEST THAT TC 15S IS BEGINNING TO SHOW EARLY SIGNS OF WEAKENING. ENVIRONMENTAL ANALYSIS SHOWS VERY LOW VERTICAL WIND SHEAR (VWS), EXCELLENT EQUATORWARD AND POLEWARD OUTFLOW, AND WARM SSTS (28-29C). TC 15S IS NOW TRACKING SOUTHWESTWARD AS IT ROUNDS THE WESTERN EDGE OF A SUBTROPICAL RIDGE.
THE TRACK IS FORECAST TO SHIFT FURTHER POLEWARD AND BRING TC 15S INTO AN UNFAVORABLE ENVIRONMENT WITH INCREASING VWS AND COOLING SSTS. THE SYSTEM IS FORECAST TO WEAKEN, SLOWLY AT FIRST, THEN MORE RAPIDLY AS THE CYCLONE DISSIPATES OVER WATER BY AROUND TAU 72. DYNAMIC MODEL GUIDANCE CONTINUES TO SHOW GOOD AGREEMENT WITH TIGHT
GROUPING BETWEEN SOLUTIONS, LENDING TO HIGH CONFIDENCE IN THE FORECAST TRACK. MAXIMUM SIGNIFICANT WAVE HEIGHT AT 220600Z IS 52 FEET.
From JTWC


Animation of Tropical Cyclone Marcus over darwin