
Severe Tropical Cyclone Debbie
Severe Tropical Cyclone Debbie developed into a category 4 cyclone before making landfall.
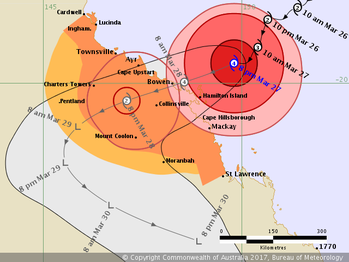
On 25 March 2017 a tropical low in the Coral Sea off the coast of north Queensland tracked south before turning south west and developing into Tropical Cyclone (TC) Debbie. TC Debbie took a south-westerly track while intensifying to make landfall as a category 4 Severe Tropical Cyclone (STC) at Arlie Beach around 12:40 (AEST) on 28 March 2017.
Severe Tropical Cyclone Debbie details

Storm Surge and Storm Tide levels during the passage of Severe Tropical Cyclone Debbie
A storm surge resulted from the extreme wind speeds and very low pressure during the passage, particularly at sites within the zone of maximum winds. The largest storm surge of 2.66m was reported by the Queensland Governments (DSITI) storm tide gauge at Laguna Quays. The storm surge to the south of the landfall point was considerably larger than to the north (at Bowen) of the landfall point due to the wind direction being offshore to the south.

Storm surge and storm tide levels at Laguna Quays, 27 to 29 March 2017. From STC Debbie fact sheet, ccby State of Queensland (DSITI)
| Site | Maximum Storm Surge (m) | Maximum Storm Tide (m.LAT) | Maximum Storm Tide (m,HAT) |
| Bowen | 0.52 | 3.57 | -0.16 |
| Laguna Quays | 2.66 | 7.21 | 0.91 |
| Shute Harbor | 1.23 | 4.54 | 0.21 |
| Mackay | 1.11 | 6.64 | 0.06 |
Ex- Tropical Cyclone Debbie continued down the Queensland coast and crossed back over the coast at the Gold Coast
After making landfall STC Debbie continued to track inland towards the south west until it was downgraded to a tropical low. The intense low pressure system then followed a southerly arc towards the coast before veering south along the coast and crossing back to sea near the Gold Coast.
The intense tropical low pressure system that remained in the wake of STC-Debbie moved southward along the Queensland coast south of Bundaberg. The system brought severe weather conditions to the coastal regions in its path. Strong winds from the north east battered the south east coastal region from around midday up to midnight on 30 March 2017. Heavy rainfall before during and after the passage of ex-STC Debbie brought flooding to several river systems in the region.
Storm surges were recorded at several sites throughout ex–STC Debbie’s passage. The storm tide levels did not exceed HAT until ex-STC Debbie had moved off shore and the winds had swung to the south east. The largest storm surge of 0.90 m was recorded at Hervey Bay in the Urangan Boat Harbour.
A maximum wave height of 9.55 m was recorded at the Brisbane wave monitoring site and 6.15 m at Mooloolaba. The Gold Coast wave buoy reported a maximum wave height of 5.72 m.
Storm Surge and Storm Tide levels during the passage of ex-STC Debbie
| Site | Maximum Storm Surge (m) | Maximum Storm Tide (m,LAT) | Maximum Storm Tide (m,HAT) |
| Urangan | 0.90 | 4.03 | -0.25 |
| Mooloolaba | 0.31 | 1.98 | -0.19 |
| Tangalooma | 0.42 | 2.39 | -0.12 |
| Scarborough | 0.77 | 2.42 | 0.01 |
| Shorncliffe | 0.88 | 2.55 | -0.07 |
| Brisbane Bar | 0.75 | 2.56 | -0.17 |
| Gold Coast Seaway | 0.44 | 1.82 | -0.09 |
| Russell Island Moreton bay | 0.75 | 2.28 | -0.61 |